Scientists: CryoEM Structure
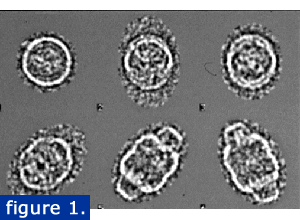
A collaboration between the Rome lab and Phoebe Stewart's lab here at UCLA was initiated to carry out a cryoEM analysis of the vault.Two former doctoral students, Lawrence Kong and Amara Siva (now Drs. Kong and Siva) led the reconstruction effort. Vaults were purified using a modification of our previously published method that included a CSCl gradient. Individual particles were quick frozen in liquid ethane and viewed by TEM. Images were captured with a digital camera and analyzed using IMAGIC software. The raw cryo-EM vault images are shown at right in various orientations from end to side views. Images that showed the particle broken or distorted were not included in the reconstruction.
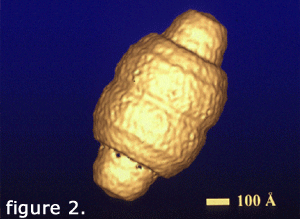
Over 1300 particle images were combined to calculate a 31 angstrom resolution structure of the vault (Kong et al., 1999). This structure (figure 2, left) was generated with cyclic eightfold symmetry. It reveals a smooth outer shell with a barrel-shaped midsection and two protruding caps.
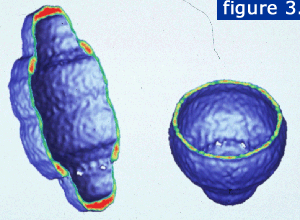
A slice through the particle reveals the hollow internal structure (figure 3). The planes are displayed with the strongest density in red and the weakest density in green.
To locate the position of the vRNA, vaults were treated with RNases, and 3,476 particle images were combined to generate a 22-angstrom resolution stucture. Difference mapping between the RNase-treated vault and the intact vault recontruction revealed the vRNA to be at the ends of the vault.
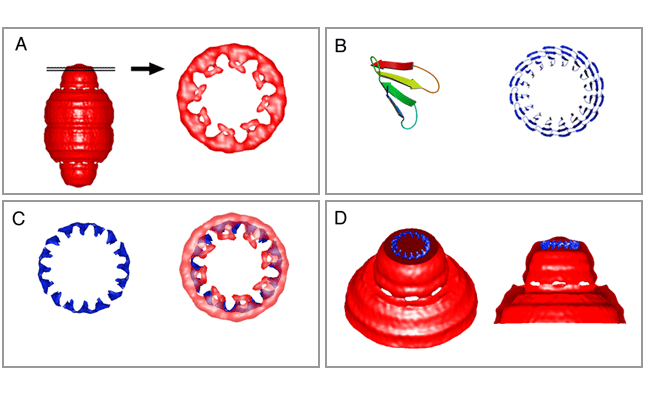
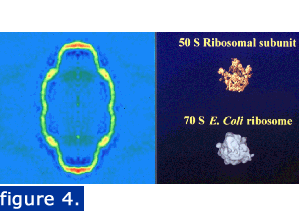
The vault is large enough to enclose particles such as ribosomal subunits. Figure 4 shows a central density slice and two ribosomal subunits illustrated at the same magnification. The finding of a 16-fold density ring at the top of the cap allowed modeling of the WD40 repeat domain of the vault TEP1 protein within the cryo-EM vault density. This density ring can be seen in panel A of the figure at the bottom of this page where a slice through the top of the 22-angstrom cryoEM reconstruction of the RNase treated vault is displayed (Kong et al., 2000) The 16 WD40 repeat domain of TEP1 was modeled (panel B) and a low-resolution image was also produced (panel C, left image). This domain could be aligned with the 16-fold density slice (panel C, right image). The location modeled would place TEP1 in the vault at a location adjacent to the vRNA (see below).
An examination of vault structure from mTep1 deficient mice gave support to this proposed TEP1 localization. Cryo-electron microscopy and three-dimensional image reconstruction was performed on mTep1 deficient vaults.
It was noted that the mTep1-/- vault was most similar to the RNase-treated rat vault, in which the vRNA was reduced to below detectable levels (Kong et al., 2000).
This finding is consistent with the observation that vRNA does not stably associate with the mTep1-/- vault. The most significant difference between the mTep1-/- vault and the RNase-treated vault was found at the ends of the vault caps (Kickhoefer et al., 2001, this data is illustrated in the TEP1 Section). The reconstruction of the Tep1 deficient vault supports the localization of at least a portion of TEP1 to the ends of the vault caps, placing it next to the assigned location of vRNA.
